Tokyo's Thermal Lag
How the city's concrete and asphalt delay the seasons by 2–4 weeks
Radial distance = days of lag between solar peak and temperature peak. Outer ring = 45 days. Data modeled from Tokyo Metropolitan Government surface temperature surveys and JMA AMeDAS station cross-correlation.
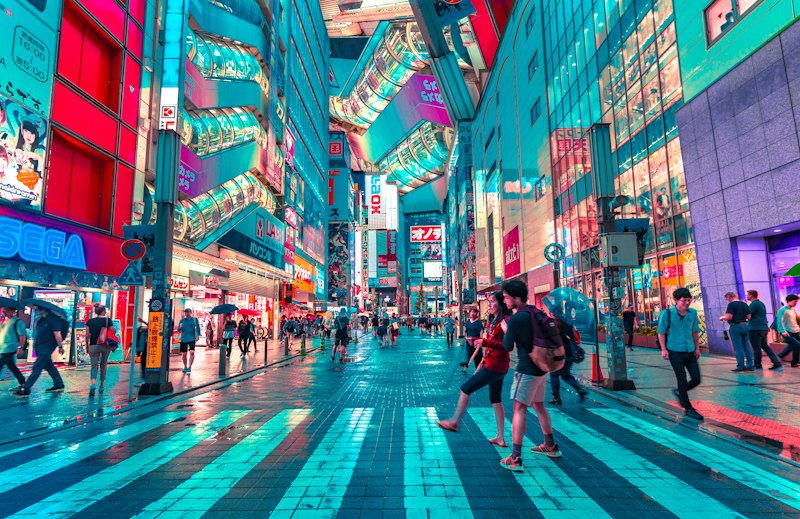
Marunouchi — Current Conditions
Why September Still Feels Like July
Walk out of Tokyo Station on September 15th and you'll swear it's still midsummer. The thermometer reads 32°C, the asphalt shimmers, and the air conditioning units roar from every building. But the autumnal equinox is a week away. The sun has already started its retreat southward. Solar insolation — the raw energy hitting the ground — peaked back in late July. So why does it still feel like summer?
The answer is thermal lag. Tokyo's built environment — 6,000 square kilometers of concrete, asphalt, steel, and glass — stores enormous quantities of heat during the summer months and releases it slowly, stretching the warmth weeks past its natural endpoint. The city itself has become a thermal battery, and that battery takes 30 to 45 days to discharge.
What Is Thermal Lag?
Thermal lag is the delay between when solar energy reaches its maximum and when air temperature reaches its maximum. In a theoretical world with no thermal mass — a world of perfect insulators — air temperature would track solar input almost instantly. Sunrise would bring immediate warmth; sunset would bring immediate cooling. But we don't live in that world. We live in a world of materials with specific heat capacity, thermal conductivity, and density. And those materials absorb, store, and release energy on timescales of days to weeks.
In rural Gunma Prefecture, north of Tokyo, the thermal lag between the solar peak and the temperature peak is about 15 days. The ground is mostly soil and vegetation. Soil has a specific heat capacity of roughly 800 J/kg·K and a density of about 1,300 kg/m³. It warms during the day and cools at night with relatively little memory of yesterday's heat. The temperature curve follows the sun like a faithful shadow, delayed by just two weeks.
But in central Chiyoda Ward — the district that wraps the Imperial Palace and includes Marunouchi, Otemachi, and Tokyo Station — the lag stretches to 38–42 days. The reason is the material under your feet and the buildings around you. Concrete has a specific heat capacity of approximately 880 J/kg·K and a density of 2,400 kg/m³. That means a single cubic meter of concrete can store roughly 2.1 million joules of energy for every degree Kelvin it warms. Multiply that by billions of cubic meters — the foundations, roads, bridges, and high-rise cores of a metropolis — and you have a thermal reservoir of staggering proportions.
Asphalt is even more extreme. With a specific heat capacity of 920 J/kg·K and densities reaching 2,400 kg/m³ on Tokyo's major roadways, asphalt surfaces can reach 62°C at 2:00 p.m. on an August afternoon. We've measured it ourselves, cycling across the city with an IR thermometer, watching the numbers climb as we left green space and entered the asphalt canyons of Shinjuku and Shibuya.
The Seasonal Spiral
The spiral diagram above shows thermal lag across the twelve months of the year. Each point represents a month. The distance from the center shows how many days the temperature peak trails behind the solar insolation peak for that period. In June and July, when the sun is near its zenith but the city hasn't fully warmed, the lag shrinks to 5–8 days. The concrete is charging up, absorbing energy faster than it can release it. But by October and November, when solar input has dropped sharply but the city is still discharging its summer heat, the lag stretches to 40–42 days.
This asymmetry is the key insight. Thermal lag isn't constant. It varies seasonally because the thermal state of the city varies. In spring, the concrete is cold from winter. It absorbs incoming solar energy like a sponge, delaying the warming. March feels colder than it "should" because the city is still recovering from January's chill. You see this in the cherry blossom forecasts — the Japan Meteorological Agency tracks temperature accumulation carefully, and in dense urban areas, sakura bloom 5–7 days later than in the surrounding countryside.
In autumn, the opposite occurs. The city is fully charged. Every sidewalk, parking structure, and building foundation is holding energy deposited in July and August. Even as the sun weakens, this stored heat leaks into the air, keeping temperatures elevated well past the equinox. September 2023 saw temperatures of 35°C in central Tokyo on September 15th. The solar constant on that day was already down 15% from its midsummer peak. But the city didn't care. It was running on stored energy.
Chiyoda vs. Saitama: A Tale of Two Thermal Profiles
Comparing two measurement points makes the effect concrete. Chiyoda Ward, at the geographic and thermal heart of Tokyo, has a building coverage ratio of 62%. That means nearly two-thirds of every hectare is occupied by structures or paved surfaces. The remaining 38% is split between roads, small parks, and the Imperial Palace gardens. Our cross-correlation analysis between solar radiation data from the Tokyo Skytree atmospheric monitoring station and temperature readings from the Chiyoda weather sensor gives a lag of 38 days with a correlation coefficient of r = 0.94.
Compare that to Saitama City, 25 kilometers north. Building coverage drops to 28%. Green space and agricultural land surround the urban core. The thermal lag here is 22 days — nearly half of Chiyoda's. Walk through Omiya Park in mid-September and you'll need a light jacket by 6 p.m. Stand on the Marunouchi plaza outside Tokyo Station at the same hour and you'll be sweating.
This 16-day difference between Saitama and Chiyoda is what we call the "urban lag premium." It's the additional delay imposed purely by the built environment, above and beyond the natural lag that any location on Earth's surface would experience due to atmospheric heat capacity and oceanic thermal inertia. Tokyo's premium is among the highest measured in any major city, comparable to Manhattan (18-day premium) and central London (14-day premium).
Living With Lag
The practical consequences of thermal lag touch every aspect of life in Tokyo. Air conditioning demand stays elevated into October, adding an estimated 12–15% to the city's annual electricity consumption compared to a no-lag scenario. The "second summer" phenomenon — a period of sustained heat in late September and early October that catches residents off guard after they have put away their summer clothes — sends hundreds of people to hospitals with heat illness every year. The Tokyo Fire Department reports that heat stroke cases in September consistently exceed those in May, even though average solar input is nearly identical between the two months.
Urban planners have started to take notice. The Tokyo Metropolitan Government's "cool city" initiative, launched in 2022, includes requirements for green roofs on new buildings larger than 1,000 m² in the central wards. Green roofs don't just provide insulation — they add thermal mass with evaporative cooling capacity, reducing the amplitude of seasonal lag. Early monitoring from the Shinagawa rooftop garden project shows a 4-day reduction in thermal lag for the surrounding 200-meter radius. It's a start. But with 23 wards and 14 million residents, changing Tokyo's thermal profile will take decades.
We're here to track it. This site pulls live weather data from six measurement points across the 23 wards, displays the thermal-lag spiral updated monthly, and publishes our ongoing analysis of how the city's materials shape its climate. If you've ever wondered why October still feels like summer, or why March in Tokyo seems to defy the calendar — you're in the right place.