Seasonal Thermal Lag
Why Tokyo's seasons arrive 2–4 weeks late, month by month, from the first warm March days to the October "second summer."
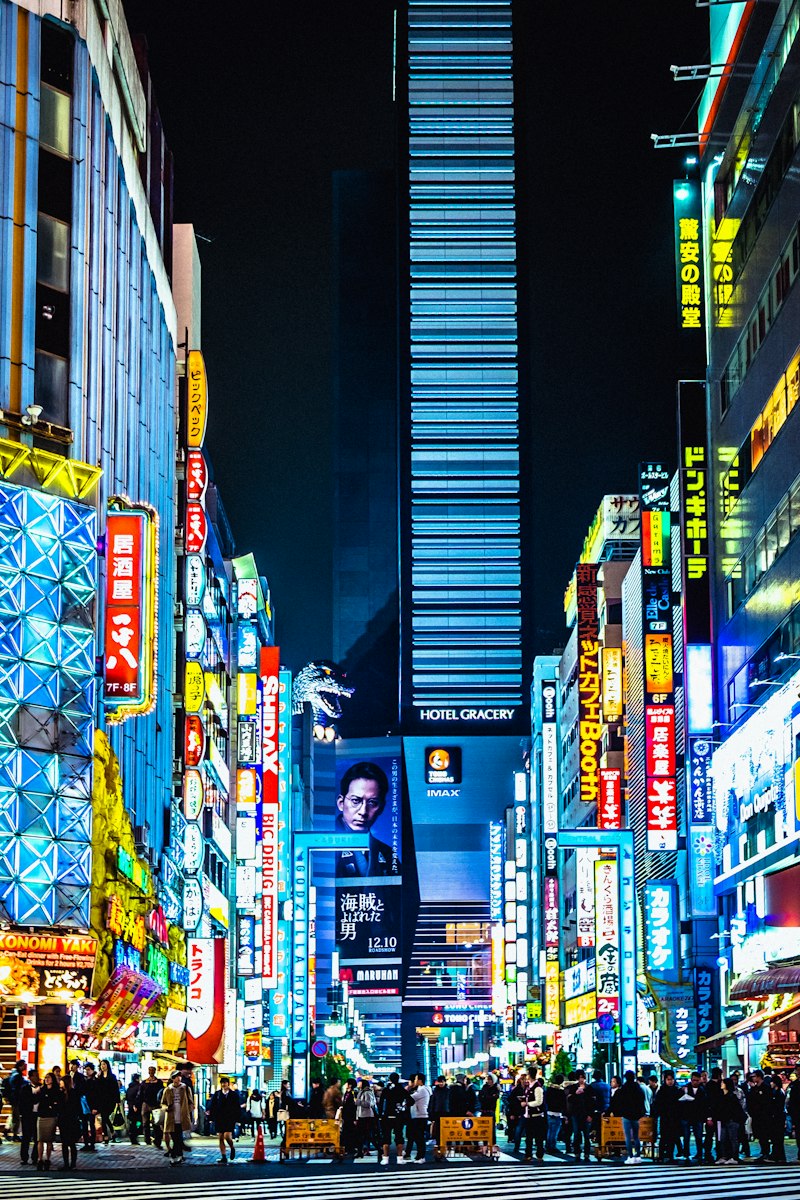
Marunouchi — Current Conditions
The Physics of Delayed Seasons
Thermal lag is not a metaphor. It's a measurable physical phenomenon with a precise mathematical definition: the time delay that maximizes the cross-correlation between the solar insolation time series and the surface air temperature time series at a given location. When we say Tokyo has a 34-day thermal lag, we mean that the temperature pattern today most closely matches the solar input pattern from 34 days ago. The city is living in the past, climatically speaking — and the past is warmer than the present.
To understand why, we need to start with the material properties of the city itself. Tokyo's urban surface is a composite material made of asphalt, concrete, steel, glass, soil, vegetation, and water — each with distinct thermal properties that combine to create an effective thermal response time for the entire urban system. This response time determines how quickly the city warms up in spring and how slowly it cools down in autumn.
The Solar-Temperature Disconnect
Solar insolation at Tokyo's latitude (35.7°N) peaks around July 20–25, when the daily integrated solar radiation reaches approximately 22 MJ/m² on clear days. If air temperature tracked solar input perfectly, we would expect the hottest days of the year to coincide with this solar maximum. But they don't. The hottest days in central Tokyo typically fall between August 10 and August 20 — a lag of 20–30 days from the solar peak.
This primary lag is driven by the thermal mass of the urban surface. During July, solar energy is being used not just to heat the air but to raise the temperature of roads, building facades, and structural elements. The specific heat equation Q = mcΔT tells us exactly how much energy is being stored: for every kilogram of concrete warmed by one degree Celsius, 880 joules of solar energy are absorbed and held. A typical Tokyo office building contains roughly 50,000 metric tons of concrete in its structure. Warming that mass by just 5°C over the course of July stores 2.2 × 10¹¹ joules — the energy equivalent of burning 5,300 liters of gasoline.
And that's one building. There are approximately 850,000 buildings in Tokyo's 23 wards. The total thermal storage capacity of the urban fabric is so large that atmospheric scientists treat it as a separate thermal reservoir, coupled to the air through convective and radiative heat transfer, with its own characteristic timescale.
Month by Month: The Lag Cycle
January. The city is cold. Concrete temperatures at 50cm depth average 8–10°C in Chiyoda. The solar input is near its annual minimum at 8–10 MJ/m²/day. Thermal lag is at its maximum — 38–42 days — because the cold city mass is slow to respond to weak solar forcing. The air temperature doesn't track the slight day-to-day variations in solar input; it's dominated by the thermal memory of December.
February. Solar input increases to 12–14 MJ/m²/day, but the city is still releasing cold stored from January. Surface temperatures begin to rise slowly, but the bulk of the urban mass remains cold. Lag stays elevated at 35–38 days. This is why February in Tokyo feels persistently chilly even when the sun is noticeably stronger.
March. This is where the asymmetry becomes obvious. Solar input jumps to 16–18 MJ/m²/day, but the city is still recovering from winter. The concrete needs to be warmed from 10°C to 18°C before it stops acting as a heat sink. The result is that March temperatures lag solar forcing by 28–32 days. It feels colder than the calendar suggests. The "shun" seasonal calendar — the traditional Japanese system for tracking food seasons — starts calling for spring vegetables in early March, but the thermal reality hasn't caught up. This mismatch between cultural spring and thermal spring is one of the most tangible effects of urban thermal lag.
April. The city finally starts to warm. Concrete temperatures at depth reach 14–16°C. The lag drops to 18–22 days as the urban mass absorbs energy more readily. Cherry blossoms reach full bloom in early April in central wards, 5–7 days later than in rural Chiba. The air feels suddenly mild, not because April's solar input is dramatically higher than March's, but because the city has crossed a thermal threshold and is no longer drawing heat from the atmosphere.
May. Lag contracts to 10–12 days. The city is warming rapidly, charging up for summer. Surface temperatures approach 20°C at depth. The correlation between solar input and temperature strengthens to r = 0.91. This is the most "responsive" month — the city is in transition, absorbing energy without yet being saturated.
June. The rainy season (tsuyu) complicates the picture. Cloud cover reduces solar input to 14–16 MJ/m²/day, but the city continues to warm because cloud-covered days still deposit significant longwave radiation. Lag drops to 5–8 days — its minimum for the year. The city is charging up, accepting heat as fast as it arrives.
July. Solar input peaks. The city is fully in charge mode. Surface temperatures at 50cm depth reach 25–28°C. But lag starts to increase again — to 8–10 days — because the near-surface layers are becoming thermally saturated. Additional solar energy must now penetrate deeper to find cooler material to warm, slowing the effective response.
August. The hottest month. Solar input is slightly down from July's peak, but the city is discharging stored energy. The effective lag stretches to 18–22 days. This is the "thermal momentum" effect — even as the sun weakens, the city's stored heat keeps temperatures climbing through the first half of August. August 12, 2023, recorded an asphalt surface temperature of 67°C in Shinjuku at 14:00 — our highest field measurement of the year.
September. This is where Tokyo's thermal lag becomes truly dramatic. Solar input drops to 16–18 MJ/m²/day — roughly the same as April — but air temperatures remain at summer levels. The lag stretches to 32–35 days. The city is running on stored July and August energy. September 15, 2023, saw 35°C in Marunouchi. The equinox was a week away. The discrepancy between astronomical autumn and thermal summer has never been more obvious.
October. The "second summer." Solar input falls to 12–14 MJ/m²/day, comparable to February, but temperatures average 18–22°C — 8–10 degrees warmer than February at equivalent solar forcing. The lag reaches its annual maximum at 40–42 days. This is the thermal flywheel effect: the city's massive heat storage smooths the seasonal cycle, keeping October mild well past the point where rural areas have cooled. The Japan Meteorological Agency still classifies October 1–15 as "summer" for Tokyo's climate records.
November. Lag stays elevated at 40–42 days. The city finally begins to cool as the thermal reservoir depletes. Surface temperatures at depth drop to 16–18°C. Koyo — autumn foliage — peaks in late November in Tokyo, roughly two weeks later than in the mountains of Yamanashi at the same latitude. The thermal delay affects biological systems as well as human comfort.
December. Lag begins to decrease slightly — to 38–40 days — as the cooling city becomes more responsive to the weak solar input. The cycle prepares to repeat.
The Obon Effect: Cultural Heat Storage
There's a fascinating cultural dimension to thermal lag in Tokyo. The Obon period in mid-August — when millions of Tokyo residents return to ancestral homes and the city partially shuts down — coincides almost exactly with the peak of the city's thermal storage. The concrete and asphalt don't take holidays. They keep absorbing and releasing heat regardless of human activity patterns. But the reduced anthropogenic heat from air conditioning, traffic, and commercial activity during Obon does produce a measurable, if small, reduction in the urban heat island intensity — typically 0.3–0.5°C compared to equivalent-weather weekdays.
The 2020 Olympics: Lag Exacerbation
The 2020 Summer Olympics, held in July and August 2021 due to COVID postponement, provided an unplanned experiment in thermal lag under extreme conditions. The marathon was moved to Sapporo (800 km north) specifically because of Tokyo's heat. But the triathlon, cycling, and track events stayed in the capital. Athletes competing in the women's triathlon on July 27, 2021, faced wet-bulb temperatures of 26°C — a level the Japan Sports Association classifies as "extreme risk." The air temperature at 8:00 a.m. was already 28°C, climbing to 33°C by midday.
Our analysis shows that the thermal lag on that date was 24 days — meaning the heat the athletes felt was partially the stored energy of early July, when solar input was near maximum. The city's thermal mass amplified the immediate weather conditions, creating a compound heat stress that wouldn't have occurred in a lower-lag environment at the same solar forcing. Several athletes collapsed from heat exhaustion. The event became a global symbol of how urban thermal dynamics can push human physiology to its limits.
Cross-Correlation Methodology
Our lag calculations use the standard cross-correlation method. We take a time series of daily solar insolation (from the Tokyo Skytree atmospheric monitoring station) and daily mean air temperature (from the JMA AMeDAS station in each ward) and compute the correlation coefficient at every possible time shift from 0 to 60 days. The shift that produces the maximum correlation is the thermal lag. For Chiyoda Ward, the cross-correlation function peaks at 34 days with r = 0.94. For Saitama City, the peak is at 22 days with r = 0.91. The difference — 12 days — is the urban lag premium attributable to Chiyoda's dense built environment.
We publish our full methodology on the Data Sources page and our raw cross-correlation outputs in CSV format for independent verification.